Querying Azure Diagnostics from Table Storage
Monday, January 14, 2013
by asalvo
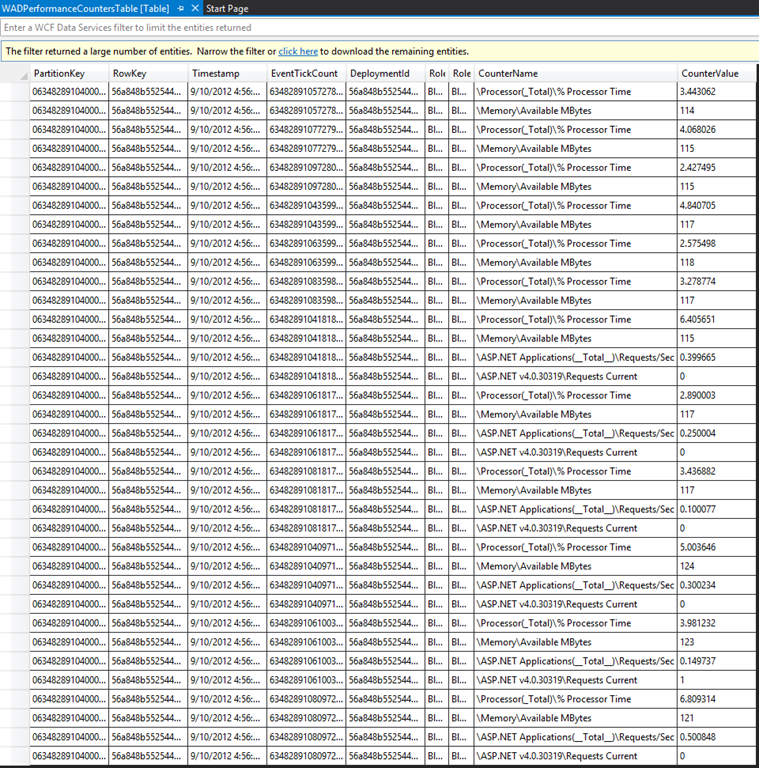
If you have enabled Windows Azure Diagnostics for your Azure project, you get 4 Azure Tables, three of which contain meaningful diagnostic data (the 4th is used to track where logfiles were stored on the actual role instances). Using either the Storage Explorer built in to Visual Studio, or a 3rd Party tool like Azure Storage Explorer (make sure to download the newest version by going to the downloads page) you can then view this information.
|

|
| Visual Studio | Azure Storage Explorer |
As with most logging scenarios, you will quickly build up a large amount of data. Unless you are able to use this data efficiently, it makes no sense to log the data in the first place.
Queries
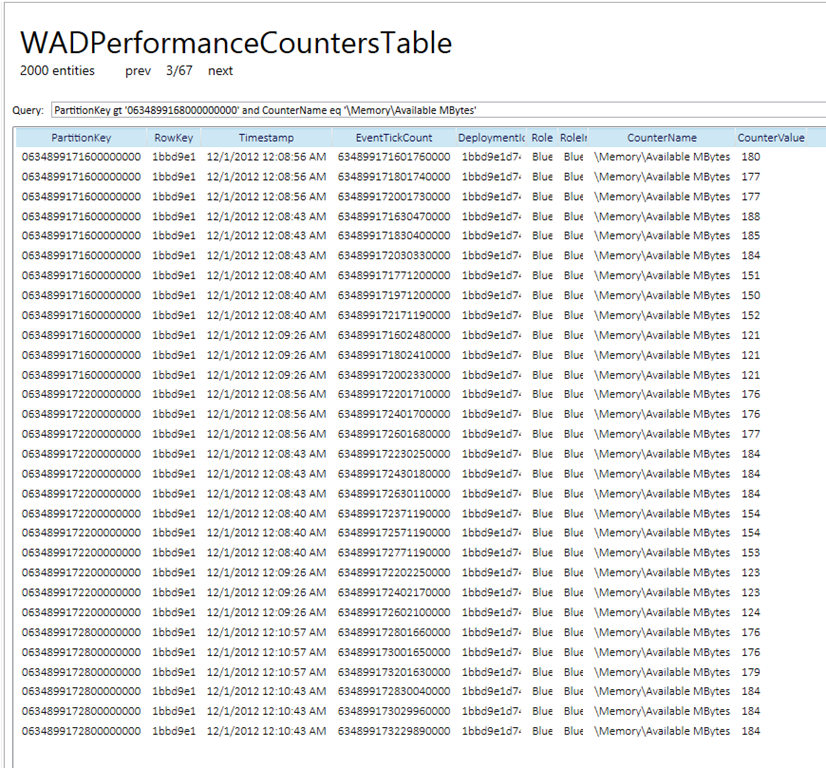
Both Azure Storage Explorer and Visual Studio offer you the ability to filter the results using OData query syntax. The key to efficient queries in Azure Table Storage, is to always make use of the partition key, as this value is indexed. For the Azure Diagnostic Data, the partition key is a string value in the format of 0 + TickCount.
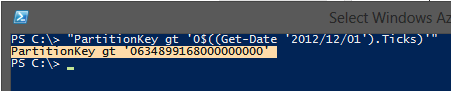
A quick way to get the tick count for a given data/time is to use a simple powershell command. Simply open up a powershell command prompt and execute the following command (the “ “ are important).
"PartitionKey gt '0$((Get-Date '2012/12/01').Ticks)'"
The output will be a string value which you can highlight and press enter to copy to your clipboard, and then paste into either tool.
The image below shows the results of a query which looks for data that was created after 12/1/2012 and only for the performance counter '\Memory\Available MBytes'
Commercial Software
If you are looking for a commercial offering that has more features and support, then you should check out Azure Diagnostics Manager by Red Gate (formally Cerebrata). It has a 30 day trial and costs $195.