Adding PerformancePoint Dashboard Content to SharePoint
Sunday, February 10, 2013
by jsalvo
Microsoft SharePoint Server 2010 provides several options for creating Dashboards using PerformancePoint content.
The first option is to implement the dashboard in PerformancePoint Dashboard Designer. In PerformancePoint Dashboard Designer, you create components such as Filters, Analytics Charts, Analytics Grids, Scorecards and KPIs. Once you’ve built the individual components, you can then create a Dashboard containing any combination of these components and create connections between the components.
The first step is to create the individual dashboard content (Filters, Analytics Charts, Analytics Grids, etc.) in PerformancePoint and save the content to a ‘PerformancePoint Content List’ in SharePoint. To save the content to SharePoint, simply click ‘Save’ within PerformancePoint Dashboard Designer.
Next, you create a Dashboard in PerformancePoint Dashboard Designer that contains the desired content and deploy the Dashboard to a ‘Dashboards Library’ in SharePoint.
To deploy a Dashboard from within PerformancePoint Dashboard Designer to SharePoint, follow the steps listed below:
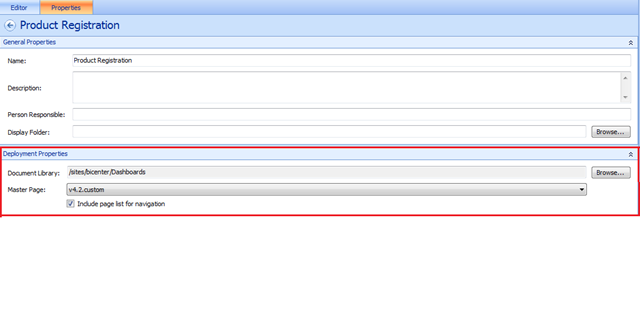
- Open the Dashboard file in PerformancePoint Dashboard Designer and click the ‘Properties’ tab. Confirm the the deployment properties are correct:
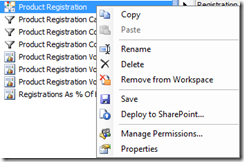
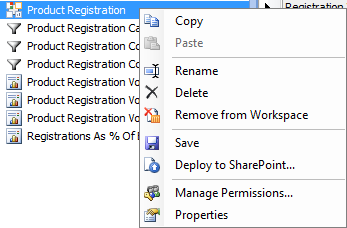
- Right click on the Dashboard component in the left hand Workspace Browser and select ‘Deploy to SharePoint’.
The following is an example of a Dashboard created in PerformancePoint Dashboard Designer:
The second option to add PerformancePoint content to SharePoint is to create a Web Parts page in SharePoint and add various PerformancePoint Web Parts. In this case, you still create the dashboard content (Filters, Analytics Charts, Analytics Grids, etc.) in PerformancePoint Dashboard Designer and save the content to a ‘PerformancePoint Content List’ in SharePoint.
Instead of creating the Dashboard within PerformancePoint Dashboard Designer, the dashboard is built by inserting PerformancePoint Web Parts to a page in SharePoint and creating any necessary connections between the web parts (such as connecting a filter to charts or tables).
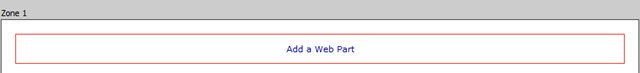
To add a PerformancePoint Web Part to a SharePoint page, click ‘Add a Web Part’.
A Web Parts pane opens where you can select the Web Part you want to insert. In the ‘Categories’ section, select PerformancePoint. The associated PerformancePoint Web Parts are displayed on the right.
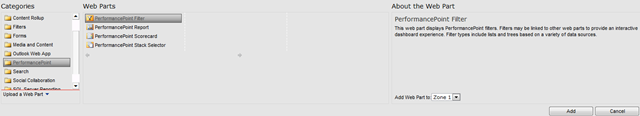
Select the appropriate Web Part and click ‘Add’ to add the Web Part to the page.
Continue adding Web Parts to the page until all desired content is included. You can re-arrange the order and layout of Web Parts as needed.
Once the necessary Web Parts are added, you can create connections between Web Parts. For example, you can connect a PerformancePoint Filter to one or more charts or grids.
To connect a filter to an Analytics Grid or Analytics Chart, follow the steps listed below:
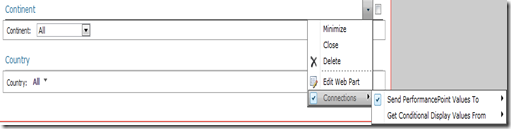
- Click the drop-down on the appropriate PerformancePoint filter Web Part and point to ‘Connections’.
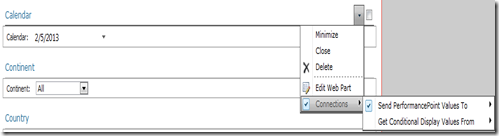
- Point to ‘Send PerformancePoint Values To’ and select the Web Part you want to send the filter values to, such as an Analytics Grid or Analytics Chart. You should now see a form to configure the connection, similar to the one shown below:
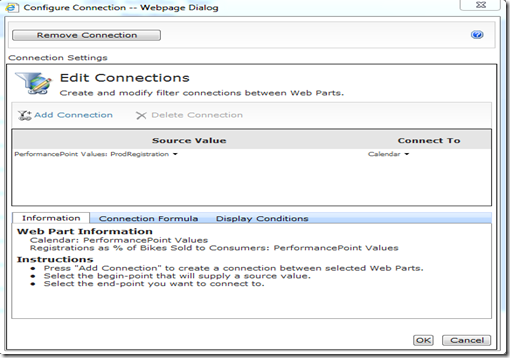
- In the ‘Source Value’ field, select the filter value you want to send. A few options are DisplayValue, MemberUniqueName and Formula.
- In the ‘Connect To’ field, select the parameter in the report or chart to receive the Filter value. In this example, I am sending the filter value to a parameter called ‘Calendar’.
- Optional: You can also specify a Connection Formula. For example, if you want to filter by the last 12 months, click the ‘Connection Formula’ tab and type Month-12:Month (to learn more about Time Intelligence Connection Formulas, check out this page).
- Click ‘OK’ to create the connection.


In addition to connecting PerformancePoint Filters to Analytic Grids and Analytics Charts, you can also create connections between filters for cascading parameter behavior (such as sending Continent filter data to a Country filter).
To create cascading filter behavior, follow the steps listed below:
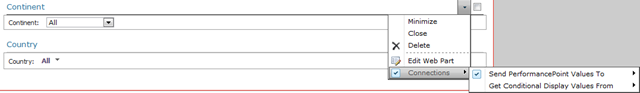
- Click the drop-down on the appropriate PerformancePoint Filter Web Part and point to ‘Connections’.
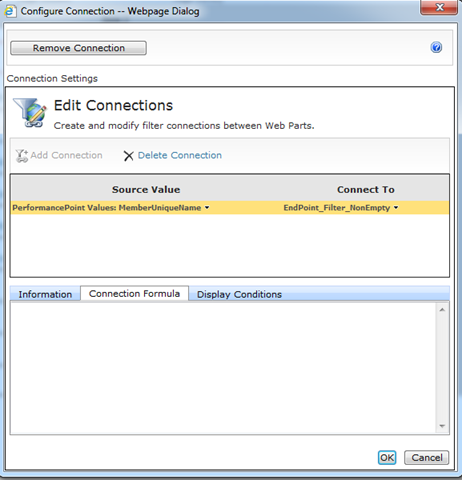
- Point to ‘Send PerformancePoint Values To’ and select the Web Part you want to send the filter values to, in this case select another Filter. You should now see a form to configure the connection, similar to the one shown below:
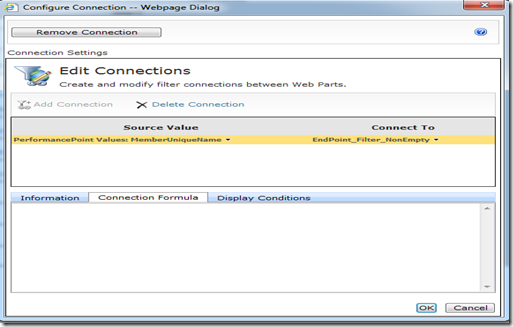
- In the ‘Source Value’ field, select MemberUniqueName. In the ‘Connect To’ field should contain ‘EndPoint_Filter_NonEmpty’.
- Click ‘OK’ to create the connection.