SQL Server Analysis Services Tabular KPIs
Sunday, February 3, 2013
by jsalvo
A few weeks ago, I wrote a blog post that discusses implementing KPIs in SQL Server Analysis Services Multidimensional. For those of you who are unfamiliar with the KPI functionality in the Multidimensional model, the blog post can be found here. I’m now going to discuss the KPI functionality in the Tabular model that was introduced in SQL Server 2012.
KPI functionality in the Tabular model of SSAS is not quite as extensive as the Multidimensional model. SSAS Tabular KPIs consist of the following properties:
- Base Value: A measure in the tabular model that defines the KPIs actual value.
- Target Value: A measure or absolute value that defines the KPIs goal or target.
- Status Threshold: Defines the range between a low and high threshold. An icon is displayed to help users easily determine the status of the base value compared to the target value.
The Multidimensional model includes a few additional properties such as Trend Expression that evaluates the KPI performance over time. This feature is not included in SSAS Tabular KPIs as far as I am aware, although you can implement similar functionality as a separate KPI to evaluate a trend over time. Another difference between the Multidimensional and Tabular KPI functionality is related to the Status Expression or Status Threshold. In Multidimensional, the Status Expression is written in MDX and must return a value between 1 and –1. Tabular KPIs are simpler in that we select a value or percentage in a GUI that defines the low and high ends of the range.
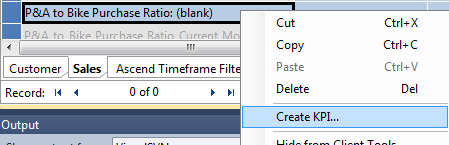
To create a KPI in SSAS Tabular, we first select the measure that we want to use as the Base Value. In this example, the measure is ‘P&A to Bike Purchase Ratio’. This measure defines a ratio of Parts and Accessories to Bike sales.
Once you have selected a measure to use as the Base Value for the KPI, right-click and select ‘Create KPI’.
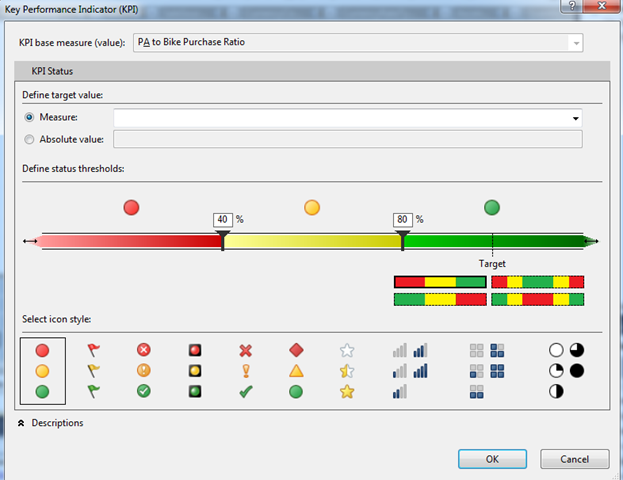
You should now see the KPI form displayed below:
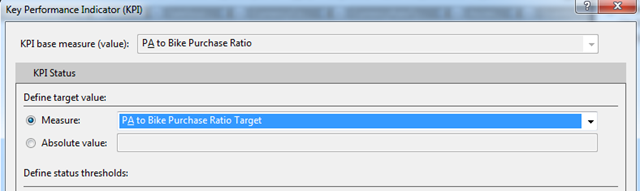
Next, select a measure in the Measure drop-down that defines the ‘Target Value’ of the KPI (as an alternative, you can also enter a value in the Absolute value field). In this example, the measure that specifies the Target value is ‘P&A to Bike Purchase Ratio Target’.
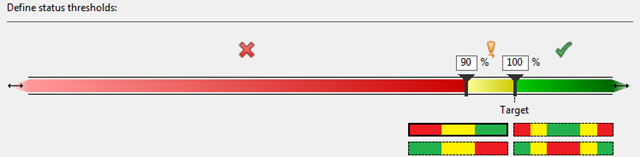
Now you can define the ‘Status Threshold’ for the KPI. In this example, anything less than 90% is negative; 90% – 100% is neutral; and above 100% is positive. To set these values, simply drag and drop the arrows to the appropriate locations on the status bar.
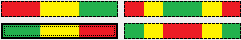
When you set the Status Threshold, you have the option to change the definition of the status ranges. For example, if less than 90% is considered positive you can select the spectrum with green on the left side of the range (as opposed to the right side which is the default). Four options are currently available:
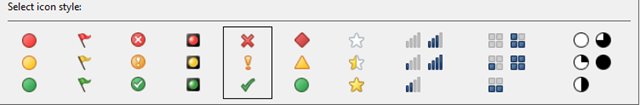
You can also change the Status icon. By default, the Status icon is displayed as a circle in either green, yellow or red. The options currently available are shown below:
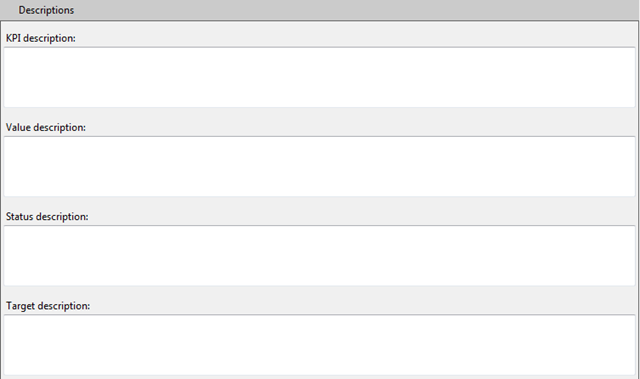
At the bottom of the form is a section labeled ‘Descriptions’. In this section, you can type in a description or definition for the properties of the KPI.
Once you’ve completed the KPI form, it should look similar to the following. Click ‘OK’ to create the KPI.
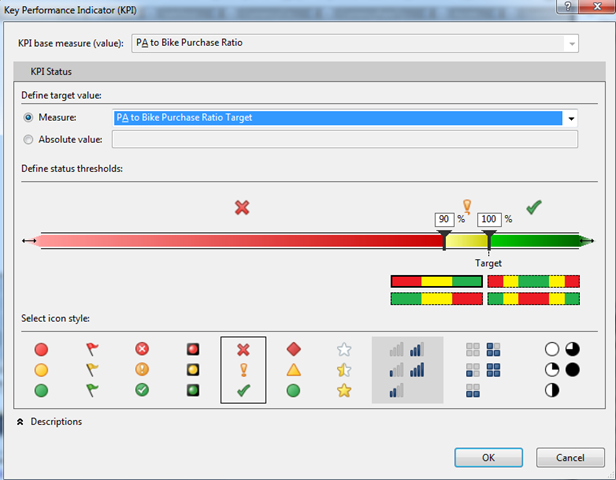
(Note: there appears to be a bug in the SQL Server 2012 KPI functionality. The icon always displays as a circle regardless of the option selected.)
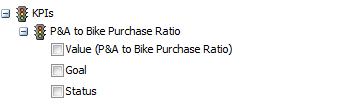
Once you’ve created the KPI and deployed the Tabular cube, you can connect to the cube in Excel. The KPI you created should be displayed in the KPIs section.
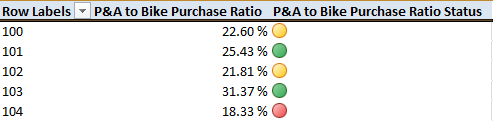
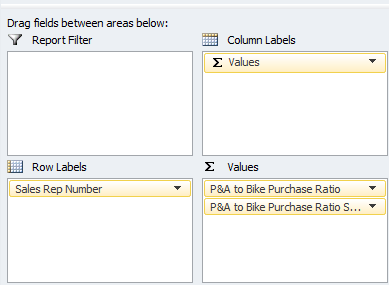
I will now drag the KPI Value and Status fields into the Values region in Excel and place the Sales Rep Number on the rows:
The following is an example of how the KPI looks within Excel: